III.IV.1
Detection of multicollinearity
Since
we have seen that strong linear associations between exogenous
variables are not always catastrophic, it seems that good detection
measures for "bad" multicollinearity are no spurious
luxury.
Let
us have a look at some possible diagnostics (or symptoms).
1.
correlation matrix between exogenous variables
It
is obvious that the linear correlations are the easiest detection
diagnostic available to the researcher. Though it should be noted
that this is no good measure for "bad" multicollinearity,
as stated above.
2.
high R-square and low T-Stats
This
criterion, like the previous, doesn't give us clear-cut answers with
respect to the harmfulness of multicollinearity.
3.
high R-square and low quadratic partial correlations between an
exogenous variable and the dependent variable
By
definition, a partial correlation coefficient between a variable X
(exogenous) and another variable Y (endogenous), given that a third
variable Z (exogenous) remains constant, is
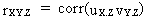
(III.IV.1-1)
where
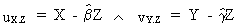
(III.IV.1-2)

Clearly
this measure is much better than the previous ones. Above that, one
may introduce more than just one exogenous variable Z, which is held
constant.
Correlation matrix:

rho(  employ.dba(-0),    ship.dba(-0)) = +0.9344

rho(  expend.dba(-0),    ship.dba(-0)) = +0.9055

rho(  expend.dba(-0),  employ.dba(-0)) = +0.8467


Partial Correlation matrix:

phi(  employ.dba(-0),    ship.dba(-0)) = +0.7429

phi(  expend.dba(-0),    ship.dba(-0)) = +0.6034

phi(  expend.dba(-0),  employ.dba(-0)) = +0.0037
Observe
how in the above example the partial correlation between expend and
ship is much lower than the correlation coefficient.
4.
eigenvalues
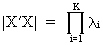
First
compute the eigenvalues of the matrix X'X.
In case of linear dependence between the variables the eigenvalues
of all different eigenvectors will differ much from each other, such
that the ratio

(III.IV.1-3)
becomes
quite large. If the square root of k (c.q. the condition number) is
much larger than (approx.) 30 this could be, according to many
authors, a sign of harmful multicollinearity.
The
variance of the OLS regression parameters can be shown to be equal
to the residual variance multiplied by the sum of the variance
proportions of all eigenvalues. This so-called Variance Decomposition Analysis (Belsley, Kuh, and Welsch) gives us
much more detailed information.
Below
you ll find an example of how the condition index and the Variance
Decomposition Analysis
can be used to test for possible multicollinearity (this test is
applied to our example-equation):
Variance Decomposition Analysis:


computing X'X and trace

trace = 1877722.


compare convergence 853155.2309 versus 0.8531552309

compare convergence 284385.077 versus 0.8531552309

compare convergence 94795.02565 versus 0.8531552309

compare convergence 31598.34188 versus 0.8531552309

compare convergence 10532.78063 versus 0.8531552309

compare convergence 3510.926876 versus 0.8531552309

compare convergence 1170.308959 versus 0.8531552309

compare convergence 390.1029862 versus 0.8531552309

compare convergence 130.0343287 versus 0.8531552309

compare convergence 43.34477625 versus 0.8531552309

compare convergence 14.44825875 versus 0.8531552309

compare convergence 4.81608625 versus 0.8531552309

compare convergence 1.605362083 versus 0.8531552309

compare convergence 0.5351206944 versus 0.8531552309
Variance decomp. proportions
eigen value     V(b1)           V(b2)           V(b3)           condition index

40686.6875      0.8411622123    0.7794250194    3.233608407e-00 6.719400896 OK

1837018.116     3.372416044e-00 9.537926949e-00 4.356289766e-01 1. OK

17.19699145     0.1554653717    0.1251957111    0.9999999677    326.8364479 > 30
5.
determinants
When
the matrix X'X contains
columns or rows which are linearly dependent from each other, we
call this matrix singular (and can therefore not invert it). If the
matrix is only almost singular, the process of inverting yields a lot of
(rounding-off-)errors.
Therefore
it is good to compute the determinant of X'X
(without constant term): if the determinant is equal to zero, this
indicates perfect multicollinearity; if the determinant is small
then this is an indication of an almost singular matrix.
Also
note that
(III.IV.1-4)
Obviously
this diagnostic is a very weak measure for "bad" (harmful)
multicollinearity. It would be better to use a measure which
reflects the sensitivity of the parameters with respect to small
changes in X'X.
For
this reason the author prefers a self-developed measure defined by
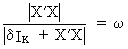
(III.IV.1-5)
where
d
is a
small number and w
is the measure.

6.
help regressions
It
is evident to see that multicollinearity always exists in case the
regressors influence each other. This can be measured by the
R-square of a regression of an arbitrary exogenous variable with
respect to all other K - 1 exogenous variables (constant included).
The
higher the R-square, the higher the degree of multicollinearity.
The
respective F-statistic may be calculated by
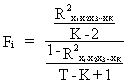
(III.IV.1-6)
The
same information might be expressed in terms of the so-called Variance Inflation Factors:

As
the name indicates, the VIF measures the factor by which the
parameters variance (in an orthogonal regression; hence without
multicollinearity) is multiplied (c.q. inflated).
Below
you ll find an example of how the condition index and the
Variance Inflation Factors can be used to test for possible
multicollinearity (this test is applied to our example-equation):
VIF(variable
1) = 13.48449151
VIF(variable 2) = 3.536336574
(Note:
the VIF of the constant term is never computed, since it is
meaningless.)
7.
sensitivity of parameters
Under
the assumptions of the general linear statistical model the author
also suggests comparing parameters of simple and multiple
regressions. It has been shown in eq. (II.II.1-27) that in case of
zero multicollinearity simple regression yields the same parameter
estimation than multiple regression. The multicollinearity problem
is proportional to the sensitivity of the parameters with respect to
the introduction of new exogenous variables. This can thus be used
for detection of possible multicollinearity, though it must be kept
in mind that simple regression (probably) suffers more from the UVB
than multiple regression.
Based
on this concept, the author has developed an (unpublished) algorithm
to compute a measure of uncertainty induced by the presence of more
than just one exogenous variables. The output of this so-called Bias
Decomposition Analysis consists of a variance measure which can be
shown to be caused ONLY by multiple exogenous variables, and NOT by
the number of observations. |